
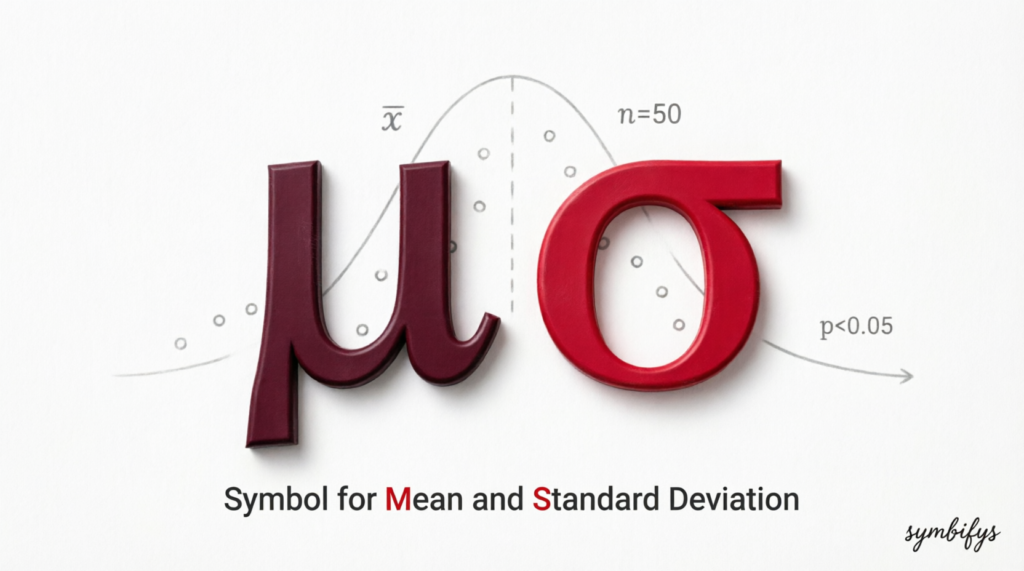
If you have ever looked at a statistics formula and wondered what x̄, μ, σ, or s actually means, you are not alone.
The symbols for mean and standard deviation appear everywhere in statistics, mathematics, research papers, psychology, education, business reports, medical studies, and data analysis. Yet they can seem confusing because the notation changes depending on whether you are working with an entire population or only a sample.
The most important distinction is simple:
The mean is usually represented by x̄ for a sample and μ for a population. Standard deviation is usually represented by s for a sample and σ for a population.
Once you understand that small difference, many statistics formulas become much easier to read.
For example, you might see:
x̄ = 72
This means the sample mean is 72.
Or:
σ = 8
This means the population standard deviation is 8.
The symbols are not merely mathematical decoration. They help researchers communicate complicated information about data quickly and precisely.
Symbol for Mean and Standard Deviation – Quick Meaning
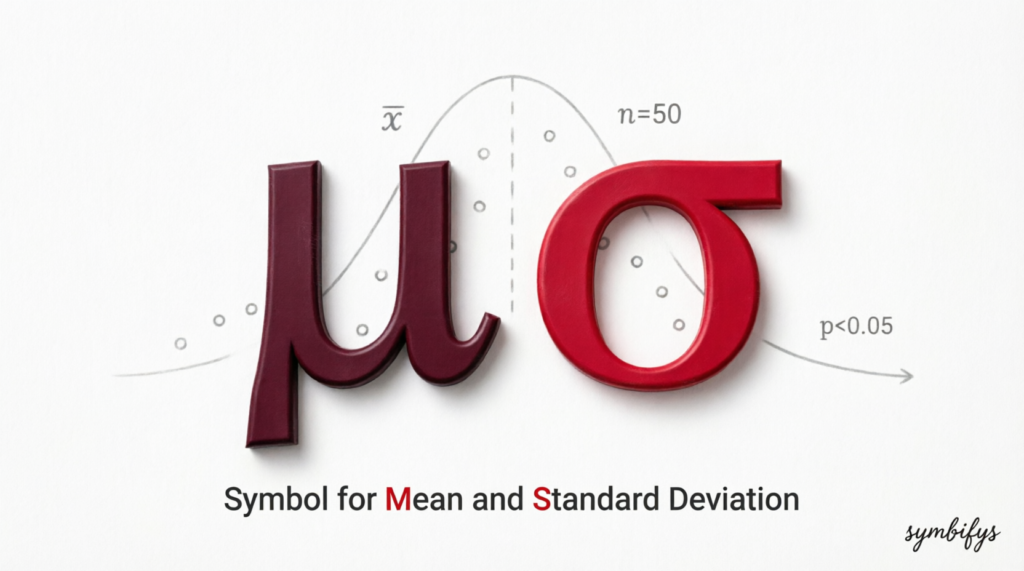
Here is the easiest way to remember the main symbols:
- x̄ = sample mean
- μ = population mean
- s = sample standard deviation
- σ = population standard deviation
The word mean usually refers to the arithmetic average.
For example, if five students score 60, 70, 80, 90, and 100, their mean is:
(60 + 70 + 80 + 90 + 100) ÷ 5 = 80
So:
“The sample mean is 80.”
Standard deviation tells you how spread out the values are around the mean.
A small standard deviation means the observations tend to stay relatively close to the average.
A larger standard deviation means the observations are more spread out.
For instance:
“The mean is 80, and the standard deviation is 3.”
The scores are relatively close together.
“The mean is 80, and the standard deviation is 20.”
The scores are much more dispersed.
The Four Symbols at a Glance
| Symbol | Meaning | Usually Used For |
|---|---|---|
| x̄ | Sample mean | A sample |
| μ | Population mean | An entire population |
| s | Sample standard deviation | A sample |
| σ | Population standard deviation | An entire population |
The most important distinction is sample versus population.
Origin & Background of the Symbols
The mathematical ideas behind averages and measures of variation developed over centuries as mathematicians, astronomers, scientists, and statisticians searched for better ways to summarize observations.
The arithmetic mean is an especially old idea. People needed ways to combine repeated measurements and arrive at a representative value.
As statistics developed into a formal discipline, notation became increasingly important.
Instead of repeatedly writing “the average of the population,” researchers could use a single symbol such as μ.
Likewise, σ became associated with population standard deviation, while s became common for sample standard deviation.
The symbols also reflect a broader principle in mathematics: compact notation makes complicated ideas easier to communicate.
A statistics textbook can say:
μ = 68.4, σ = 7.2
instead of writing a long sentence describing the population average and its dispersion.
Why the Symbols Still Matter Today
Modern statistics is used in almost every field.
Researchers compare test scores, companies study customer behavior, psychologists analyze survey results, economists examine financial data, and scientists measure physical phenomena.
The same symbols allow people from different disciplines to understand statistical results without rewriting the underlying concepts.
You may encounter them in:
- Academic research
- Psychology
- Education
- Business analytics
- Economics
- Medical research
- Sports statistics
- Survey analysis
- Scientific experiments
- Data visualization
Social media has also made statistical language more visible.
People frequently share charts, polls, averages, rankings, and performance statistics online. However, short posts often leave out the distinction between an average and the amount of variation around that average.
Understanding mean and standard deviation helps you read those claims more critically.
Real-Life Conversations
Person A:
What does this x with the line over it mean in my statistics homework?
Person B:
That’s x-bar. It usually means the sample mean.
Person A:
So basically the average?
Person B:
Exactly. It’s the average of the sample values.
Instagram DMs
Person A:
My professor wrote μ = 75 and σ = 10. I’m lost.
Person B:
μ is the population mean, and σ is the population standard deviation.
Person A:
So 75 is the average?
Person B:
Right. And 10 tells you how spread out the population values are around that average.
TikTok Comments
Person A:
Why are there different symbols for standard deviation?
Person B:
Because statistics distinguishes between a population and a sample.
Person A:
Oh, so s and σ aren’t exactly interchangeable?
Person B:
Correct. One usually represents sample SD, while the other represents population SD.
Text Messages
Person A:
I got the mean right but my SD answer is wrong.
Person B:
Did you use the sample or population formula?
Person A:
Sample.
Person B:
Then make sure you’re using n − 1 in the sample variance calculation.
Emotional & Psychological Meaning
Unlike a social-media symbol or emoji, the symbols for mean and standard deviation do not normally express emotions.
Their meaning is mathematical.
However, the ideas they represent have an interesting psychological dimension.
People naturally look for a “typical” value. When we hear that the average salary is a certain amount, the average test score is a certain number, or the average response to a survey question is a particular value, we instinctively use that average as a mental reference point.
But humans can easily forget variation.
Imagine two classrooms with the same average exam score of 75.
In Classroom A, almost everyone scores between 72 and 78.
In Classroom B, some students score 40 while others score 100.
The mean is the same, but the experience of the two classrooms is dramatically different.
That is why standard deviation matters.
In practical terms, it reminds us that an average does not tell the whole story.
A personal-style example makes this clearer. Imagine looking at your weekly study time and discovering that you average six hours per week. At first, that number sounds straightforward. But if you studied exactly six hours every week, your consistency would be very different from someone who studied zero hours one week and twelve hours the next.
The mean describes the center.
The standard deviation describes the spread.
Together, they tell a much richer story.
Usage in Different Contexts
Social Media
On social media, statistical symbols may appear in educational posts, research summaries, polls, fitness data, sports analysis, and infographics.
For example:
Mean = 72, SD = 5
This communicates both the average and the variability.
However, a social-media post may simplify the explanation too much. Always check what population or sample the numbers describe.
Friends and Relationships
You probably will not use μ or σ in an ordinary conversation about friendship or relationships.
However, statistics can become relevant when people compare survey responses, personality research, relationship studies, or behavioral data.
For example, someone might say:
“The average score was 4.2, but there was quite a lot of variation.”
That is essentially the everyday-language version of discussing a mean and standard deviation.
Work and Professional Settings
Mean and standard deviation are common in professional reports.
A company might report:
Average customer satisfaction = 8.2/10; SD = 1.1
The average indicates the central score, while the standard deviation provides information about how consistently customers responded.
A low SD could suggest that responses were clustered near 8.2.
A higher SD could indicate much greater disagreement among customers.
Casual vs. Serious Tone
The notation itself is formal.
In casual conversation, people generally say:
- “average”
- “spread”
- “variation”
- “typical value”
In academic and professional writing, symbols such as x̄, μ, s, and σ are more appropriate.
When NOT to Use It
Do not use a statistical symbol simply because it looks more sophisticated.
If you are writing for a general audience, “average” may be clearer than μ.
Similarly, writing σ = 12 without explaining what σ represents can confuse readers who are unfamiliar with statistics.
There is also an important technical situation where you should not casually substitute one symbol for another.
Do not automatically use σ when your data represent a sample.
If you are estimating a population from a sample, the sample standard deviation is commonly represented by s, while σ refers to the population standard deviation.
Likewise, do not automatically use μ for every average. In conventional statistical notation, μ usually refers specifically to a population mean.
Cultural and Educational Sensitivity
The notation is internationally used, but educational traditions can differ.
Students may encounter slightly different conventions in textbooks, software, or academic disciplines. When writing for an international audience, define your notation rather than assuming everyone interprets every symbol identically.
Common Misunderstandings
“x̄ and μ mean exactly the same thing.”
They both represent means, but they normally refer to different groups.
x̄ represents a sample mean.
μ represents a population mean.
“s and σ are interchangeable.”
Not necessarily.
s generally represents sample standard deviation.
σ generally represents population standard deviation.
“Standard deviation is another type of average.”
No.
The mean describes the center of the data.
Standard deviation describes how much the observations vary around that center.
“A large standard deviation means the average is large.”
No.
A dataset can have a very small mean and a large standard deviation.
For example, values can be centered around zero while being widely spread out.
“A small standard deviation means every value is identical.”
Not necessarily.
A small standard deviation simply means the values are relatively close to the mean.
“The symbol tells you the answer.”
The symbol identifies the statistical quantity. You still need the data and the appropriate formula to calculate it.
Comparison Table
| Symbol / Term | Meaning | Example | Main Idea |
|---|---|---|---|
| x̄ | Sample mean | x̄ = 75 | Average of sample data |
| μ | Population mean | μ = 75 | Average of population |
| s | Sample standard deviation | s = 6 | Sample variability |
| σ | Population standard deviation | σ = 6 | Population variability |
| Median | Middle value | 75 | Center based on position |
| Mode | Most frequent value | 75 | Most common observation |
| Variance | Squared measure of spread | s² | Variation before taking square root |
| Range | Maximum − minimum | 30 | Overall distance between extremes |
| IQR | Middle 50% spread | 12 | Distance between Q1 and Q3 |
Key Insight
The mean tells you where the data are centered, while standard deviation tells you how widely the data are scattered around that center. The symbols tell you whether you are describing a sample or a population.
How to Respond When Someone Uses It
If someone uses these symbols in conversation or sends you a statistics problem, your response can depend on the situation.
Casual Replies
- “x-bar is the sample average.”
- “μ is the population mean.”
- “s usually means sample standard deviation.”
Funny Replies
- “That little line over x is doing a lot of work.”
- “Statistics has a symbol for everything 😂.”
- “σ looks intimidating, but it just represents population standard deviation.”
Mature Replies
- “The notation depends on whether you’re describing a sample or the entire population.”
- “Check whether the problem gives you a sample or population before choosing the formula.”
Respectful Replies
- “If you share the question, I can help identify which symbol and formula you need.”
- “The safest approach is to define the notation before calculating.”
Regional & Cultural Usage
The symbols themselves have broadly standardized meanings in statistics, but the way they are taught can vary.
Western Culture
Universities and schools in the United States, Canada, the United Kingdom, Australia, and Europe commonly introduce μ, σ, x̄, and s when teaching inferential and descriptive statistics.
Asian Culture
Statistics education across Asian countries also commonly uses international mathematical notation.
Students may encounter additional terminology depending on their curriculum, language, and examination system.
Middle Eastern Culture
Mathematical notation is generally retained even when statistical explanations are presented in Arabic or another local language.
This allows formulas to remain recognizable across languages.
Global Internet Usage
Online educational communities have made statistics terminology much more accessible.
A student can encounter x̄ in a video, a textbook, a forum, or a shared class note and quickly search for its meaning.
That accessibility has helped turn once-specialized notation into familiar educational vocabulary.
Generational Differences
Younger students may encounter these symbols through interactive courses, short educational videos, and online calculators.
Millennials and older learners may have first encountered them in textbooks or traditional classroom settings.
The underlying mathematics, however, has not changed simply because the learning environment has.
Is It Safe for Kids?
Yes.
The symbols for mean and standard deviation are ordinary mathematical notation and are safe for children to learn.
The main challenge is educational rather than safety-related.
Younger students may understand “average” and “how spread out the numbers are” before they are ready to work comfortably with symbols such as μ and σ.
A good teaching approach is to introduce the idea first and notation second.
For example:
Average → mean → x̄ or μ
Spread → standard deviation → s or σ
This connects the unfamiliar symbols to concepts the student already understands.
FAQs
1. What is the symbol for the mean?
The most common symbols are x̄ for a sample mean and μ for a population mean.
2. What is the symbol for standard deviation?
The usual symbols are s for sample standard deviation and σ for population standard deviation.
3. What does x̄ mean?
x̄, pronounced “x-bar,” usually represents the arithmetic mean of a sample.
4. What does μ mean in statistics?
μ represents the mean of a population.
5. What does σ mean?
σ, the Greek letter sigma, commonly represents the population standard deviation.
6. What is the difference between s and σ?
s generally represents sample standard deviation, while σ represents population standard deviation.
7. Why are there different symbols for mean and standard deviation?
Different symbols distinguish between quantities calculated from a sample and parameters that describe an entire population.
Conclusion
The symbol for mean and standard deviation becomes much easier to understand once you stop treating the notation as a collection of mysterious Greek letters and start seeing what each symbol represents.
Remember the four essentials:
x̄ = sample mean
μ = population mean
s = sample standard deviation
σ = population standard deviation
The mean gives you the center of a dataset. Standard deviation gives you a sense of how much the values vary around that center.
That distinction is useful far beyond a statistics exam.
Whenever you read a research paper, survey, business report, scientific study, or data visualization, you are likely to encounter averages and variation. Knowing these symbols helps you look beyond a single headline number and ask a better question:
How much do the individual observations actually differ?
That is one of the most valuable habits in statistical thinking.
Averages simplify reality, but standard deviation reminds us that real data are rarely identical. Once you understand both, statistical results become not only easier to calculate but also much easier to interpret.
descover more post
What Does the Orange Car Symbol Mean? 9 Common Causes 2026
What Does a Diamond Symbol Mean on Jewelry 2026
What Does Prince’s Symbol Mean The Story Behind …

Mia Enderson is a dedicated content writer and digital research specialist with over 7 years of experience creating insightful and reader-focused content. She specializes in technology, business, and online trends, delivering well-researched and engaging articles. At Symbifys.com, Mia is committed to providing accurate, valuable, and easy-to-understand information that helps readers make informed decisions. Her passion for quality content and attention to detail have earned the trust of a growing audience.